Cross-fold validation results
The tables below contain the measures of metric performance for
each dataset and for all datasets combined. The plot with the
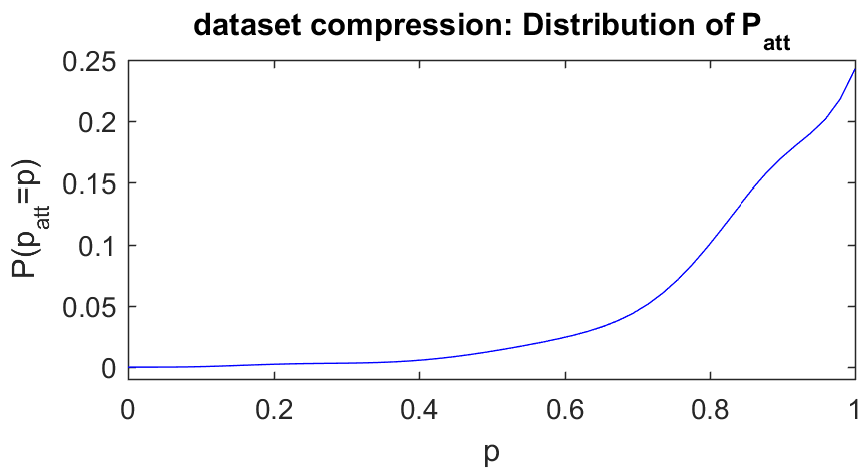
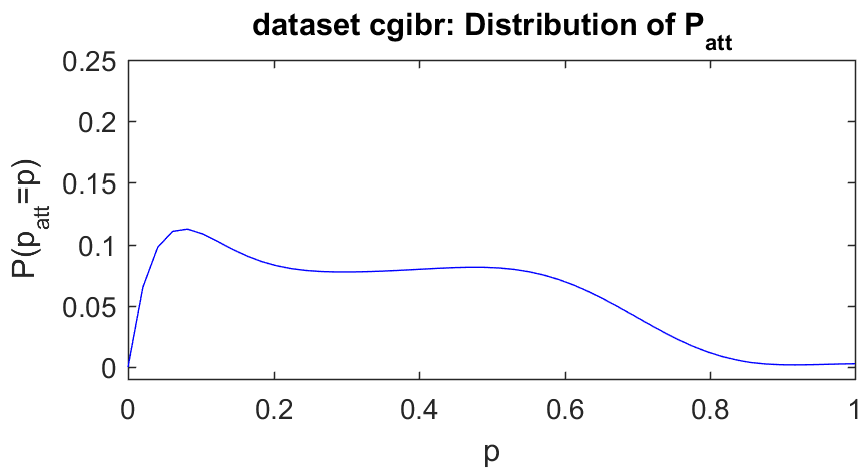
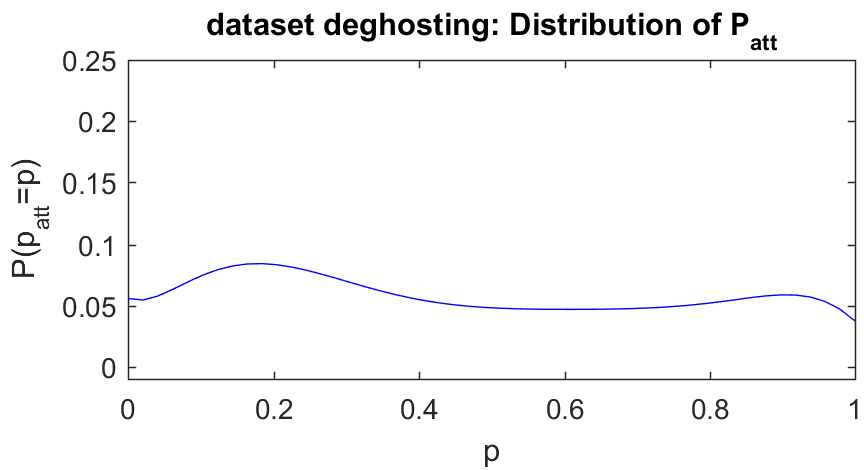
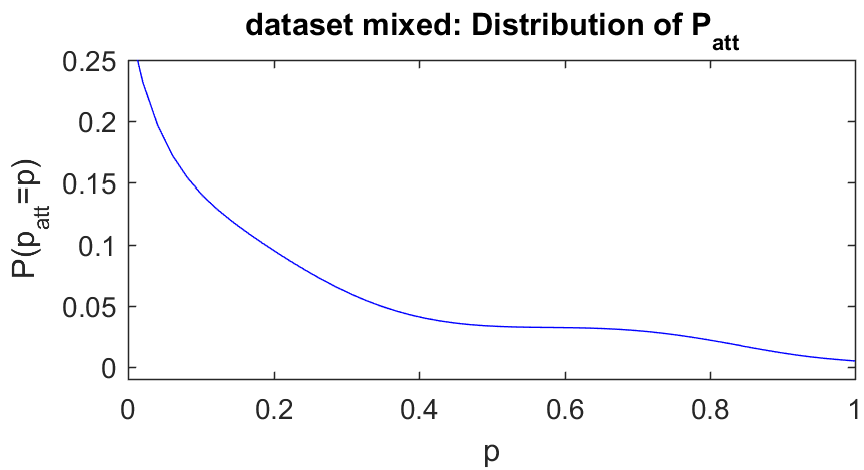
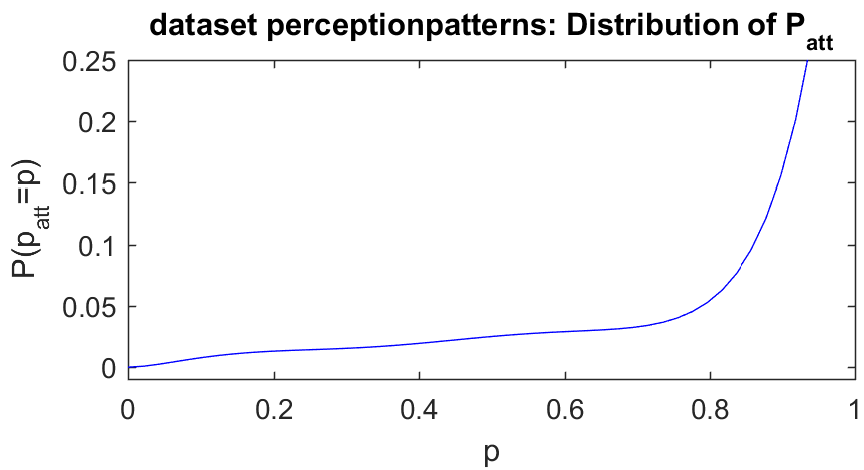
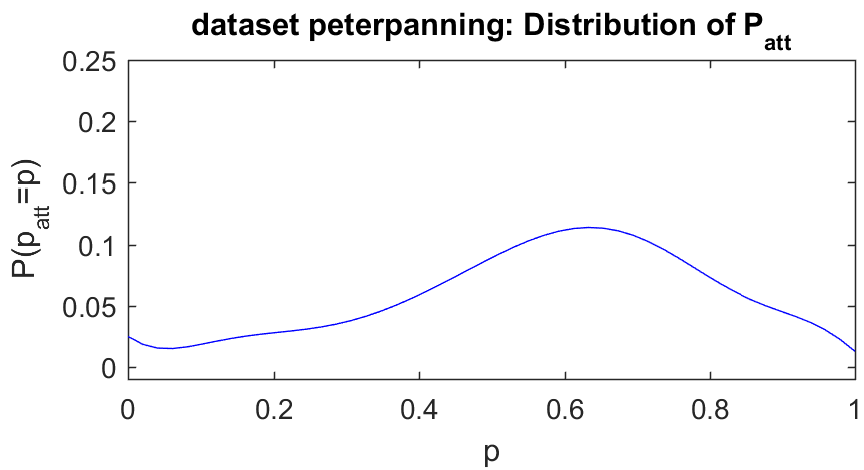
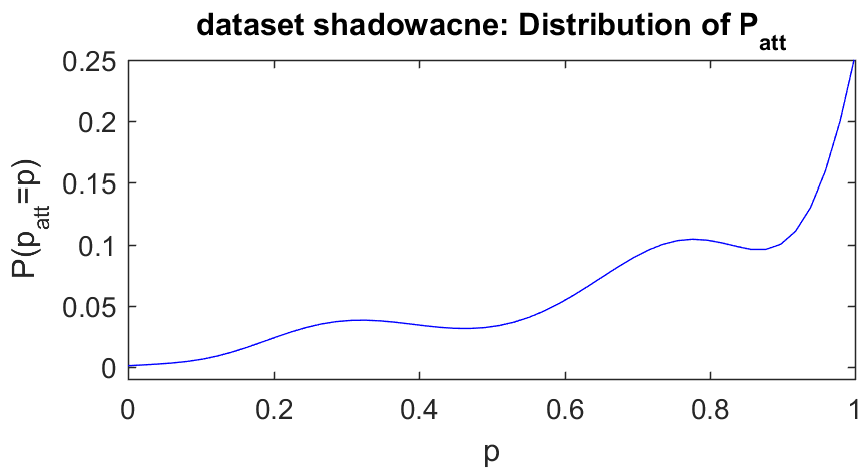
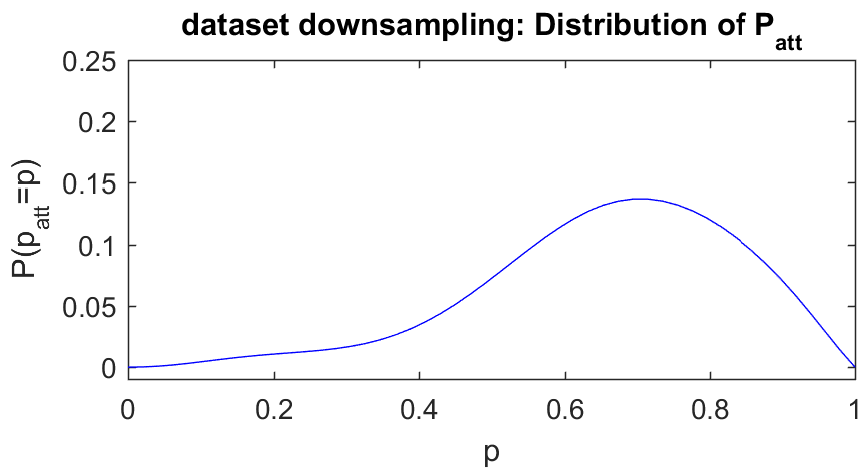
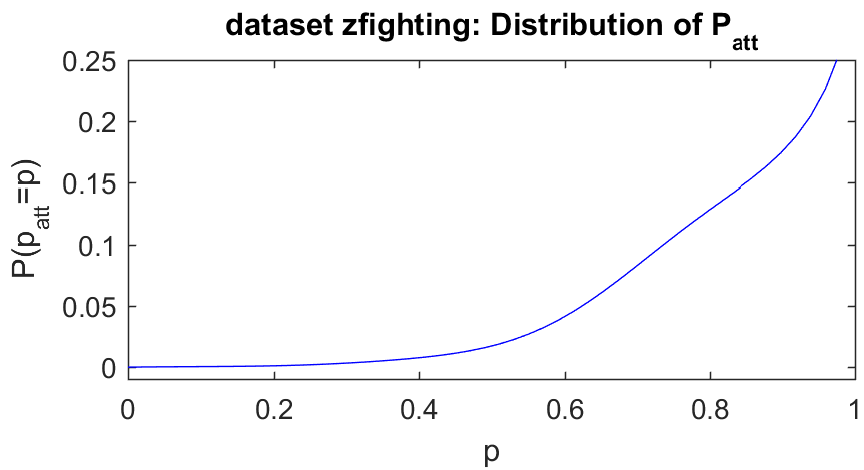
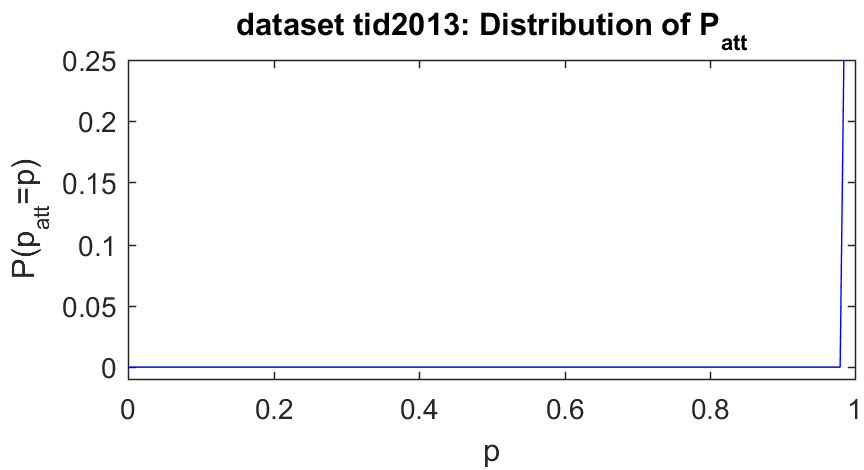
distribution of Pobs visualizes our prediction about
the the likelihood of observing the difference for a particular
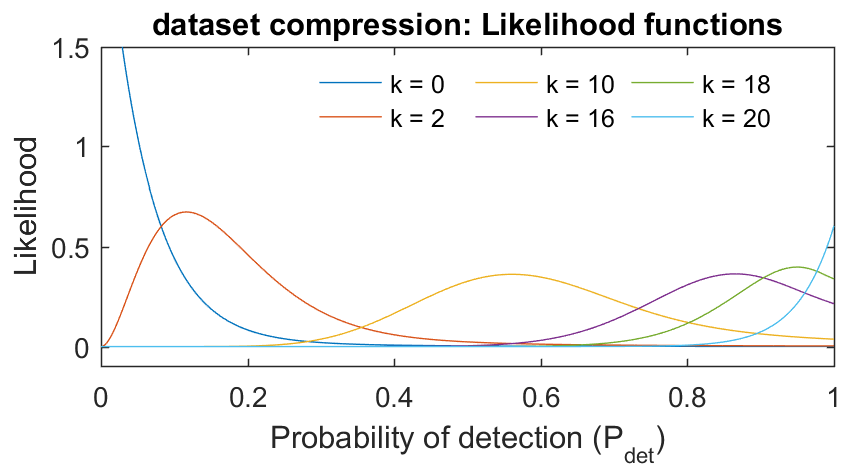
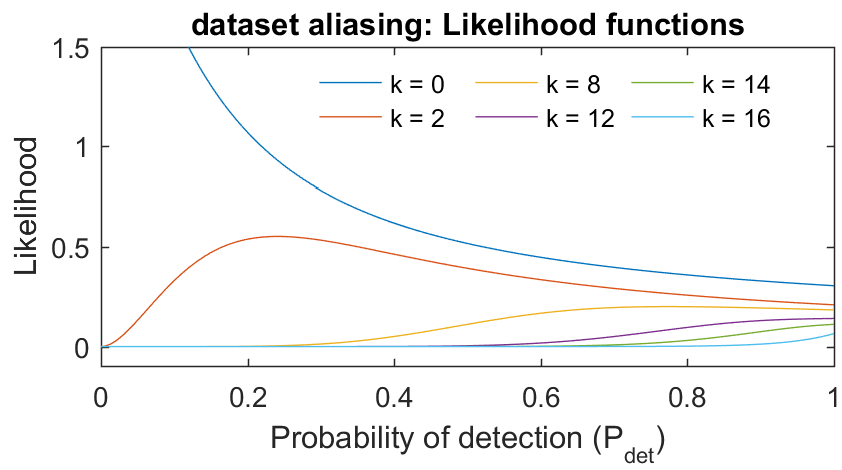
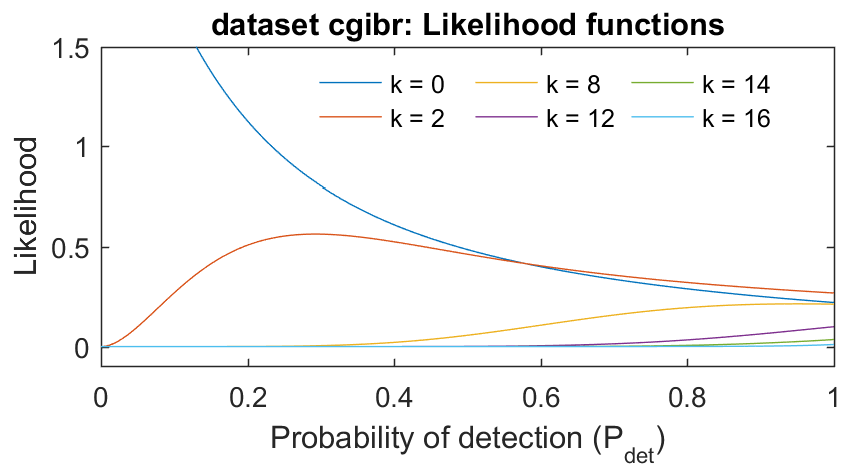
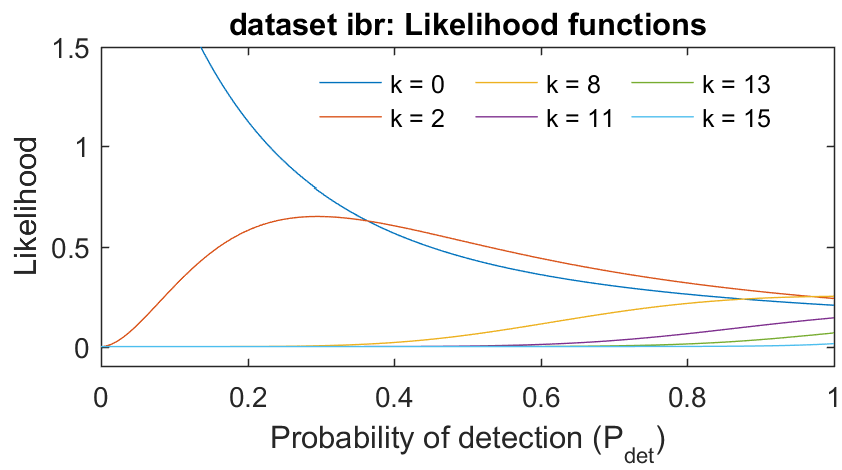
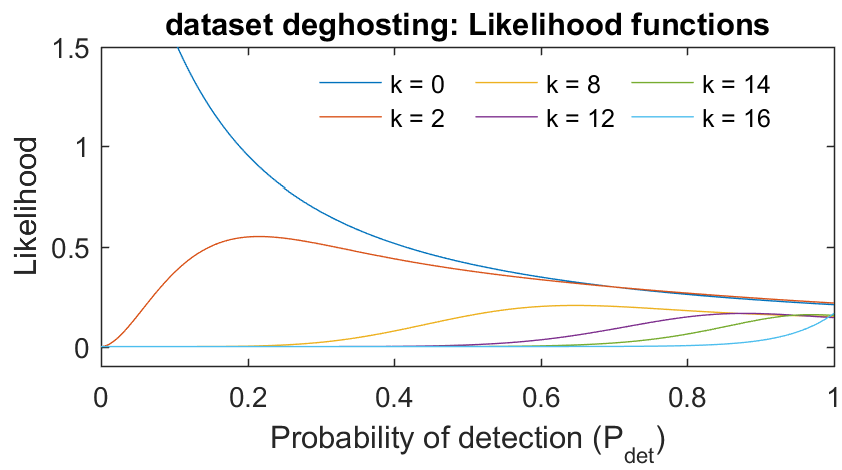
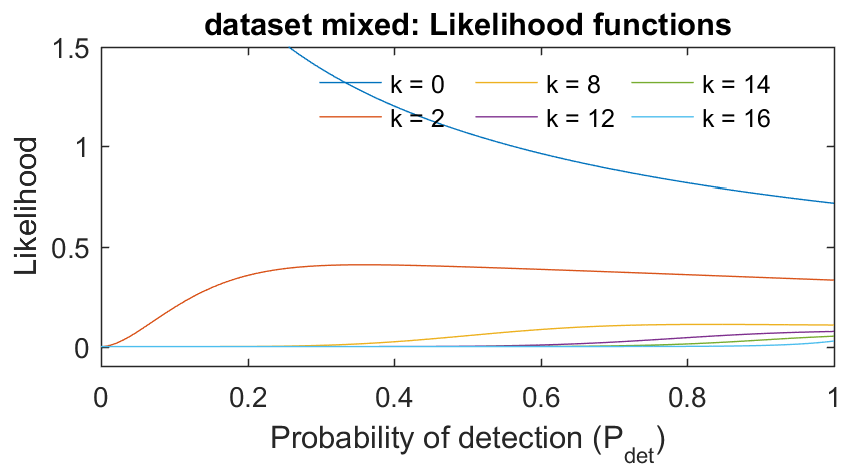
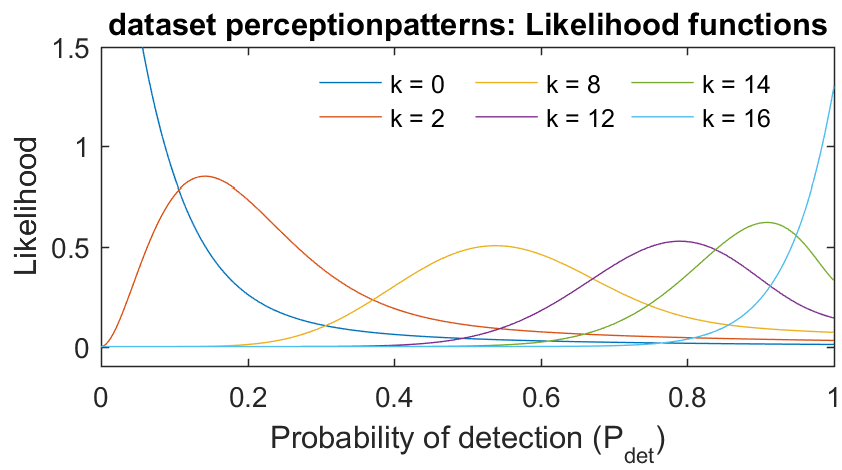
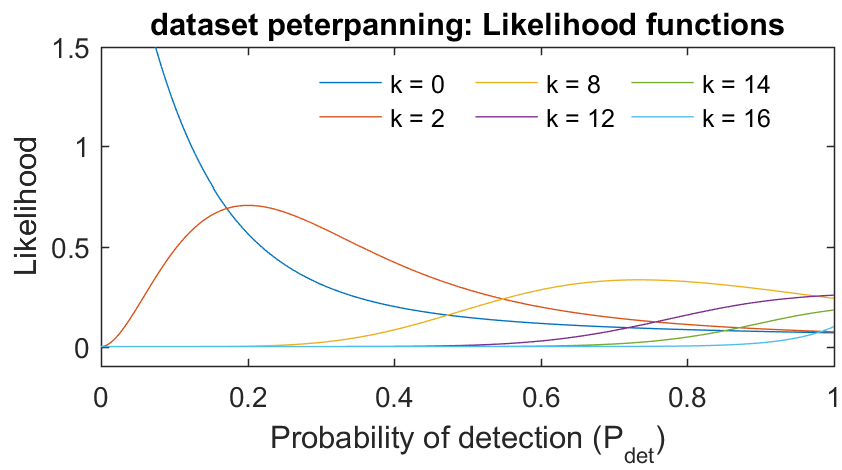
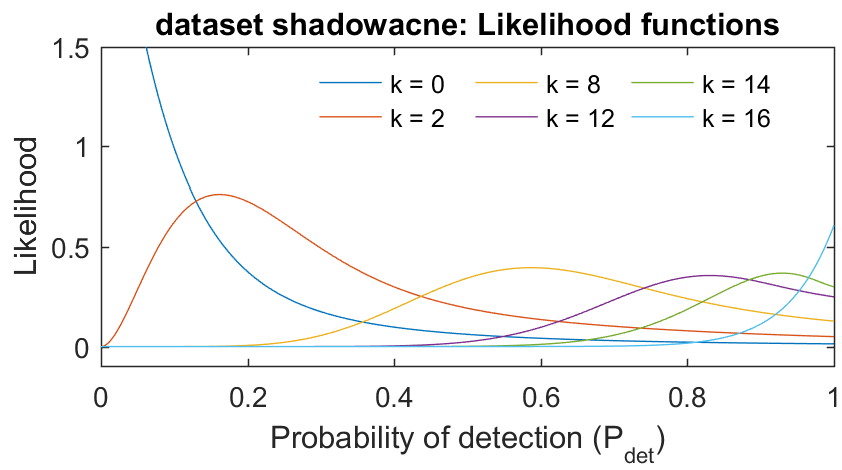
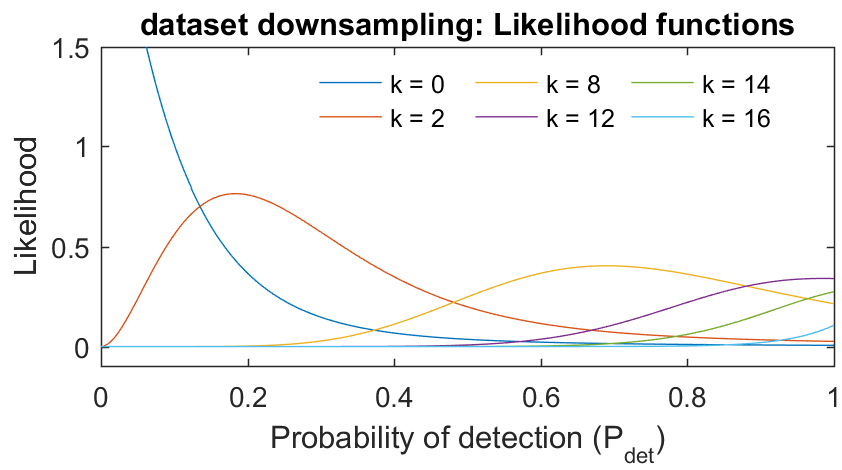
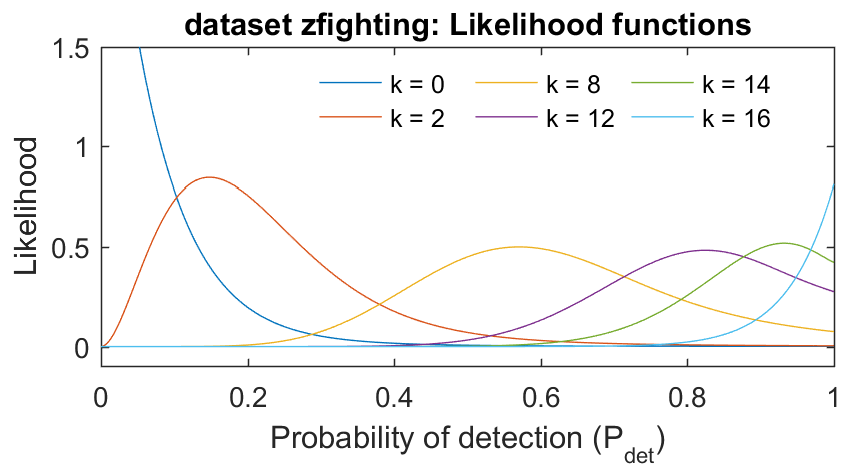
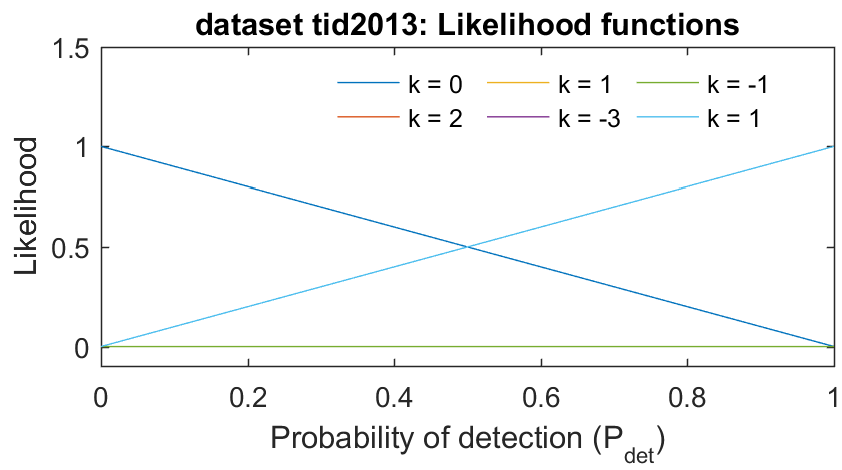
dataset. The likelihood functions showed on the right are used in the
loss function when training and testing the metrics. Different
k-values denote the number of observers marking a particular image
location and Pdet is the probability of
detection.
The reported error measures are:
- Pear. correl - Pearson correlation coefficient (the higher the better)
- Spear. correl - Spearman rank order correlation coefficient (the higher the better)
- RMSE - Root-mean-squared-error (the lower the better)
- Likelihood - the log-10 of the likelihood function used for the metric optimization (the higher the better). Note that the likelihood can be greater than 1 (log-10 likelihood greater than 0) because the values have not been normalized.
Dataset compression
71 images; detailed results
| Image Metric | Pear. correl | Spear. correl | RMSE | Likelihood |
| T-ABS | 0.316 | 0.267 | 0.321 | -1.15 |
| T-CIEDE2000 | 0.192 | 0.167 | 0.337 | -1.16 |
| T-sCIELab | 0.295 | 0.294 | 0.327 | -1.05 |
| T-SSIM | 0.422 | 0.365 | 0.334 | -1.11 |
| T-FSIM | 0.61 | 0.561 | 0.266 | -0.896 |
| T-VSI | 0.568 | 0.52 | 0.275 | -0.939 |
| T-Butteraugli | 0.807 | 0.739 | 0.184 | -0.713 |
| T-HDR-VDP | 0.774 | 0.702 | 0.202 | -0.741 |
| CNN | 0.878 | 0.798 | 0.151 | -0.582 |
Dataset aliasing
22 images; detailed results
| Image Metric | Pear. correl | Spear. correl | RMSE | Likelihood |
| T-ABS | 0.509 | 0.379 | 0.124 | -0.102 |
| T-CIEDE2000 | 0.495 | 0.378 | 0.129 | -0.112 |
| T-sCIELab | 0.529 | 0.478 | 0.124 | -0.107 |
| T-SSIM | 0.577 | 0.551 | 0.134 | -0.0827 |
| T-FSIM | 0.577 | 0.554 | 0.127 | -0.0557 |
| T-VSI | 0.569 | 0.546 | 0.126 | -0.0544 |
| T-Butteraugli | 0.615 | 0.649 | 0.117 | -0.049 |
| T-HDR-VDP | 0.545 | 0.658 | 0.12 | 0.0211 |
| CNN | 0.786 | 0.66 | 0.115 | 0.0852 |

Dataset cgibr
6 images; detailed results
| Image Metric | Pear. correl | Spear. correl | RMSE | Likelihood |
| T-ABS | 0.4 | 0.44 | 0.206 | -0.131 |
| T-CIEDE2000 | 0.413 | 0.415 | 0.161 | -0.146 |
| T-sCIELab | 0.392 | 0.474 | 0.237 | -0.18 |
| T-SSIM | 0.435 | 0.495 | 0.249 | -0.275 |
| T-FSIM | 0.45 | 0.451 | 0.286 | -0.185 |
| T-VSI | 0.464 | 0.508 | 0.264 | -0.174 |
| T-Butteraugli | 0.57 | 0.661 | 0.284 | -0.073 |
| T-HDR-VDP | 0.531 | 0.656 | 0.367 | -0.0928 |
| CNN | 0.556 | 0.596 | 0.215 | -0.138 |
Dataset ibr
36 images; detailed results
| Image Metric | Pear. correl | Spear. correl | RMSE | Likelihood |
| T-ABS | 0.394 | 0.237 | 0.157 | 0.0795 |
| T-CIEDE2000 | 0.406 | 0.244 | 0.109 | 0.1 |
| T-sCIELab | 0.427 | 0.303 | 0.168 | 0.0681 |
| T-SSIM | 0.416 | 0.286 | 0.209 | 0.0193 |
| T-FSIM | 0.442 | 0.284 | 0.247 | 0.043 |
| T-VSI | 0.407 | 0.276 | 0.221 | 0.047 |
| T-Butteraugli | 0.492 | 0.385 | 0.233 | 0.0968 |
| T-HDR-VDP | 0.451 | 0.354 | 0.317 | 0.0486 |
| CNN | 0.567 | 0.405 | 0.165 | 0.115 |

Dataset deghosting
12 images; detailed results
| Image Metric | Pear. correl | Spear. correl | RMSE | Likelihood |
| T-ABS | 0.45 | 0.252 | 0.205 | -0.158 |
| T-CIEDE2000 | 0.512 | 0.235 | 0.163 | -0.132 |
| T-sCIELab | 0.48 | 0.267 | 0.261 | -0.177 |
| T-SSIM | 0.45 | 0.362 | 0.315 | -0.202 |
| T-FSIM | 0.566 | 0.403 | 0.205 | -0.12 |
| T-VSI | 0.603 | 0.42 | 0.169 | -0.108 |
| T-Butteraugli | 0.478 | 0.345 | 0.307 | -0.169 |
| T-HDR-VDP | 0.562 | 0.303 | 0.236 | -0.135 |
| CNN | 0.653 | 0.567 | 0.182 | -0.0443 |
Dataset mixed
59 images; detailed results
| Image Metric | Pear. correl | Spear. correl | RMSE | Likelihood |
| T-ABS | 0.435 | 0.394 | 0.14 | 0.0693 |
| T-CIEDE2000 | 0.444 | 0.4 | 0.106 | 0.0524 |
| T-sCIELab | 0.364 | 0.39 | 0.152 | 0.0514 |
| T-SSIM | 0.399 | 0.393 | 0.175 | 0.0442 |
| T-FSIM | 0.491 | 0.389 | 0.187 | 0.0789 |
| T-VSI | 0.51 | 0.425 | 0.153 | 0.0745 |
| T-Butteraugli | 0.421 | 0.417 | 0.189 | 0.0802 |
| T-HDR-VDP | 0.52 | 0.441 | 0.212 | 0.108 |
| CNN | 0.628 | 0.425 | 0.139 | 0.0964 |
Dataset perceptionpatterns
34 images; detailed results
| Image Metric | Pear. correl | Spear. correl | RMSE | Likelihood |
| T-ABS | 0.418 | 0.467 | 0.291 | -0.513 |
| T-CIEDE2000 | 0.404 | 0.44 | 0.259 | -0.5 |
| T-sCIELab | 0.496 | 0.482 | 0.244 | -0.49 |
| T-SSIM | 0.365 | 0.435 | 0.355 | -0.754 |
| T-FSIM | 0.506 | 0.395 | 0.395 | -0.643 |
| T-VSI | 0.58 | 0.558 | 0.33 | -0.511 |
| T-Butteraugli | 0.506 | 0.553 | 0.308 | -0.475 |
| T-HDR-VDP | 0.539 | 0.525 | 0.438 | -0.58 |
| CNN | 0.674 | 0.475 | 0.249 | -0.455 |
Dataset peterpanning
10 images; detailed results
| Image Metric | Pear. correl | Spear. correl | RMSE | Likelihood |
| T-ABS | 0.711 | 0.175 | 0.0671 | 0.305 |
| T-CIEDE2000 | 0.68 | 0.158 | 0.0661 | 0.299 |
| T-sCIELab | 0.736 | 0.32 | 0.0989 | 0.338 |
| T-SSIM | 0.751 | 0.394 | 0.0801 | 0.334 |
| T-FSIM | 0.694 | 0.302 | 0.114 | 0.316 |
| T-VSI | 0.764 | 0.237 | 0.0786 | 0.326 |
| T-Butteraugli | 0.644 | 0.408 | 0.171 | 0.32 |
| T-HDR-VDP | 0.539 | 0.387 | 0.249 | 0.258 |
| CNN | 0.758 | 0.479 | 0.0766 | 0.348 |
Dataset shadowacne
9 images; detailed results
| Image Metric | Pear. correl | Spear. correl | RMSE | Likelihood |
| T-ABS | 0.828 | 0.305 | 0.0838 | 0.299 |
| T-CIEDE2000 | 0.789 | 0.297 | 0.0898 | 0.294 |
| T-sCIELab | 0.854 | 0.401 | 0.0993 | 0.347 |
| T-SSIM | 0.881 | 0.465 | 0.0832 | 0.345 |
| T-FSIM | 0.81 | 0.407 | 0.106 | 0.315 |
| T-VSI | 0.847 | 0.351 | 0.0824 | 0.318 |
| T-Butteraugli | 0.811 | 0.481 | 0.135 | 0.344 |
| T-HDR-VDP | 0.76 | 0.46 | 0.147 | 0.322 |
| CNN | 0.923 | 0.559 | 0.067 | 0.369 |
Dataset downsampling
27 images; detailed results
| Image Metric | Pear. correl | Spear. correl | RMSE | Likelihood |
| T-ABS | 0.564 | 0.235 | 0.0697 | 0.212 |
| T-CIEDE2000 | 0.577 | 0.234 | 0.0726 | 0.209 |
| T-sCIELab | 0.648 | 0.419 | 0.0636 | 0.223 |
| T-SSIM | 0.675 | 0.411 | 0.0632 | 0.219 |
| T-FSIM | 0.698 | 0.426 | 0.0653 | 0.228 |
| T-VSI | 0.684 | 0.399 | 0.065 | 0.223 |
| T-Butteraugli | 0.682 | 0.533 | 0.0626 | 0.245 |
| T-HDR-VDP | 0.682 | 0.474 | 0.0754 | 0.255 |
| CNN | 0.817 | 0.376 | 0.0479 | 0.256 |
Dataset zfighting
10 images; detailed results
| Image Metric | Pear. correl | Spear. correl | RMSE | Likelihood |
| T-ABS | 0.847 | 0.314 | 0.0758 | 0.288 |
| T-CIEDE2000 | 0.871 | 0.317 | 0.0702 | 0.307 |
| T-sCIELab | 0.928 | 0.382 | 0.0658 | 0.363 |
| T-SSIM | 0.893 | 0.439 | 0.068 | 0.362 |
| T-FSIM | 0.863 | 0.383 | 0.092 | 0.334 |
| T-VSI | 0.895 | 0.351 | 0.0702 | 0.324 |
| T-Butteraugli | 0.864 | 0.454 | 0.107 | 0.359 |
| T-HDR-VDP | 0.798 | 0.438 | 0.146 | 0.316 |
| CNN | 0.935 | 0.535 | 0.0656 | 0.383 |
Dataset tid2013
261 images; detailed results
| Image Metric | Pear. correl | Spear. correl | RMSE | Likelihood |
| T-ABS | 0.49 | 0.493 | 0.45 | -0.237 |
| T-CIEDE2000 | 0.455 | 0.444 | 0.458 | -0.242 |
| T-sCIELab | 0.778 | 0.75 | 0.315 | -0.13 |
| T-SSIM | 0.593 | 0.568 | 0.413 | -0.209 |
| T-FSIM | 0.884 | 0.828 | 0.237 | -0.0787 |
| T-VSI | 0.837 | 0.794 | 0.275 | -0.102 |
| T-Butteraugli | 0.865 | 0.795 | 0.252 | -0.0897 |
| T-HDR-VDP | 0.957 | 0.854 | 0.157 | -0.0429 |
| CNN | 0.986 | 0.923 | 0.0842 | -0.0102 |
All datasets
| Image Metric | Pear. correl | Spear. correl | RMSE | Likelihood |
| T-ABS | 0.587 | 0.507 | 0.288 | -0.26 |
| T-CIEDE2000 | 0.609 | 0.499 | 0.283 | -0.263 |
| T-sCIELab | 0.749 | 0.595 | 0.237 | -0.196 |
| T-SSIM | 0.607 | 0.534 | 0.296 | -0.261 |
| T-FSIM | 0.773 | 0.627 | 0.239 | -0.158 |
| T-VSI | 0.782 | 0.627 | 0.231 | -0.166 |
| T-Butteraugli | 0.799 | 0.653 | 0.227 | -0.124 |
| T-HDR-VDP | 0.802 | 0.666 | 0.245 | -0.111 |
| CNN | 0.92 | 0.755 | 0.145 | -0.0566 |
Fitted parameters for each parametric metric
The tables below contain the trained parameters for each metric.
Each column is shown for seperate fold of the 80:20 data partitioning.
The images were partitioned so that the training set never contained a scene
that was also present in the testing set.
T-ABS
| Fold | 1 | 2 | 3 | 4 | 5 |
| thr | 0.0320998 | 0.029416 | 0.0241714 | 0.0363923 | 0.0405914 |
| beta | 1.2217 | 1.08502 | 1.12467 | 1.06505 | 1.02051 |
T-CIEDE2000
| Fold | 1 | 2 | 3 | 4 | 5 |
| thr | 6.55466 | 6.25582 | 5.13933 | 7.22037 | 8.29298 |
| beta | 1.27386 | 1.23024 | 1.38956 | 1.15686 | 1.13099 |
T-sCIELab
| Fold | 1 | 2 | 3 | 4 | 5 |
| thr | 2.98988 | 2.87221 | 2.55975 | 3.01634 | 3.57053 |
| beta | 1.44352 | 1.61917 | 1.60862 | 1.49786 | 1.27204 |
T-SSIM
| Fold | 1 | 2 | 3 | 4 | 5 |
| thr | 0.41701 | 0.360274 | 0.330161 | 0.449905 | 0.368506 |
| beta | 3.79632 | 3.87352 | 2.47467 | 3.22844 | 3.60306 |
| k1 | 0.135319 | 0.105998 | 0.187379 | 0.139192 | 0.178953 |
| k2 | 0.767988 | 0.998297 | 0.993652 | 0.614528 | 0.99557 |
T-FSIM
| Fold | 1 | 2 | 3 | 4 | 5 |
| thr | 0.0123326 | 0.0140126 | 0.0239129 | 0.0289574 | 0.0289258 |
| beta | 1.11681 | 1.19778 | 0.965348 | 0.950184 | 0.874257 |
| k1 | 1.54232 | 0.112168 | 1.79319 | 0.538423 | 1.45343 |
| k2 | 465.272 | 507.059 | 139.883 | 155.229 | 139.053 |
T-VSI
| Fold | 1 | 2 | 3 | 4 | 5 |
| thr | 0.00639539 | 0.0152349 | 0.00811125 | 0.00998099 | 0.0131328 |
| beta | 1.13423 | 1.10442 | 0.80044 | 0.994662 | 0.986519 |
| k1 | 11.4743 | 5.76465 | 15.5094 | 262.608 | 2.75587 |
| k2 | 212.161 | 38.7918 | 412.85 | 411.786 | 296.098 |
| k2 | 249.399 | 49.2923 | 204.81 | 126.973 | 85.4913 |
T-Butteraugli
| Fold | 1 | 2 | 3 | 4 | 5 |
| thr | 4.57724 | 4.39537 | 5.13794 | 5.27943 | 4.97349 |
| beta | 2.17965 | 2.15649 | 1.88865 | 1.95179 | 1.99546 |
T-HDR-VDP
| Fold | 1 | 2 | 3 | 4 | 5 |
| peak_sensitivity | 3.14234 | 3.12003 | 3.03552 | 3.08941 | 3.07797 |
| mask_self | 1.34086 | 1.10952 | 1.34726 | 1.38707 | 1.31143 |
| mask_xn | -3.59236 | -1.67806 | -1.93849 | -1.27285 | -1.56384 |
| mask_p | 0.479483 | 0.434101 | 0.577003 | 0.570515 | 0.536809 |
| mask_q | 0.107436 | 0.117649 | 0.266418 | 0.297591 | 0.188229 |
| psych_func_slope | 0.374818 | 0.354784 | 0.303595 | 0.363248 | 0.329734 |
| si_sigma | -0.49228 | -0.451994 | -0.496654 | -0.492996 | -0.486882 |


